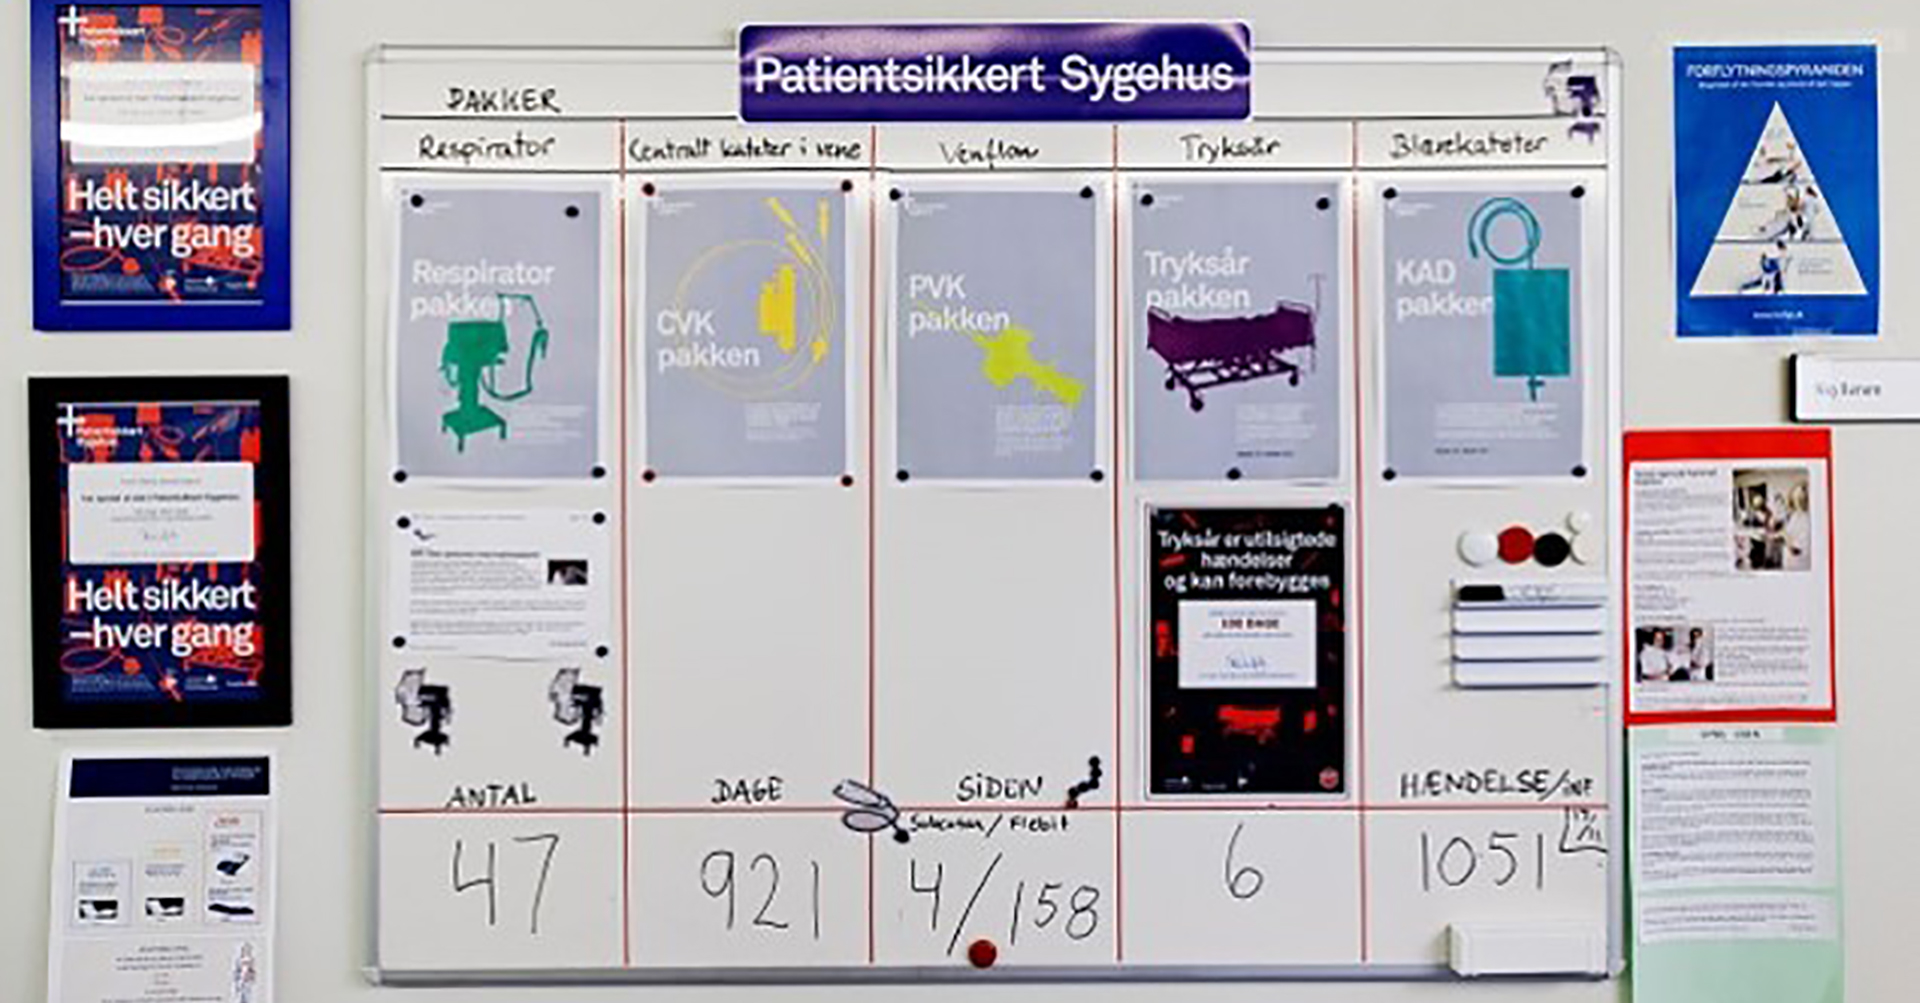
Visible patient safety. Example of a whiteboard with improvement data from the ICU at Næstved Hospital. The whiteboard is in the corridor and visible to visitors.
Patient safety becomes visible
The Danish Safer Hospital Programme has had very positive experiences with creating transparency around quality and patient safety. Almost all departments in the pro- gramme visibly present data from their improvement work to staff, and some also to patients and their families, typically on a corridor whiteboard. The department makes ongoing updates of the latest data, preferably from day to day. Examples of this could be displaying the number of days since a patient last had a pressure ulcer in the department or a catheter-associated urinary tract infection.
Experience with visible data in departments in the Danish Safer Hospital Programme has been gathered in two different surveys: Firstly, a questionnaire survey in the spring of 2013 showed that visible data has a positive, motivating effect whether it shows positive or negative results. Making data visible to patients and their families has not caused any major problems. In the questionnaire survey, only 2 % of respondents found that patients would feel unsafe when seeing data.
Secondly, focus group interviews in 2014 confirmed that visible data on the whiteboards gives rise to reflection on work processes and new ideas for work procedures, etc. This depends on having local, meaning- ful data, so that staff will relate the figures to specific patients. Data on the whiteboards becomes a hub of improvement work. However, this requires management attention to this work in regard to updating, reflect- ing, and following up on data.
Furthermore, according to the focus group interviews, the data white- boards serve as a dialogue tool towards patients and their families. However, there is work to be done to make the content more easily understandable to people who are not healthcare professionals.

